Create a Timespan Filter
A Timespan Filter allows you to filter to a subset of your data. You may filter by any data elements associated with dates, and can filter by a date range. (For instance, selecting anyone who’s lifetime falls within a certain range)
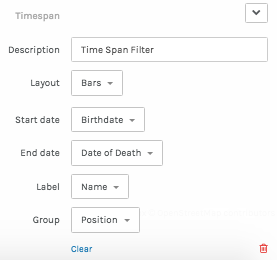
It’s possible to label each Timespan filter in the “Description” field. The layout can be a set of Bars, a Parallel view which shows each timespan as a slope corresponding to the length of the date range, or Grouped Bars. You can also select the date range Start and End Dates, label the Ranges, and group them. You can also clear the date ranges or delete the entire filter.
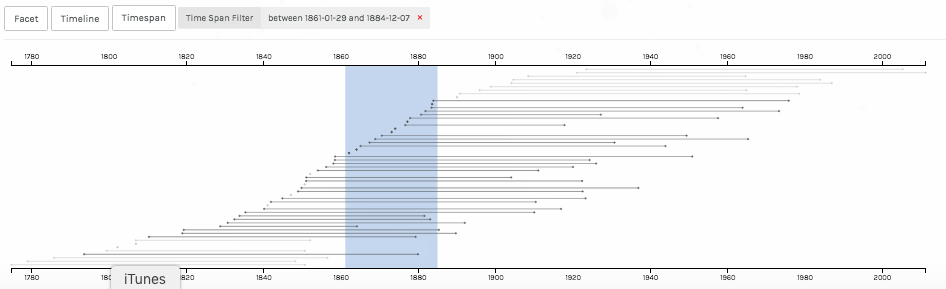
Select the time period to filter by clicking and dragging to highlight (all date ranges included in the time period will be included). Selecting the data will update the map or other visualization dynamically.
For more information on overlapping filters check the impact of overlapping filters.