What can I do with Palladio?
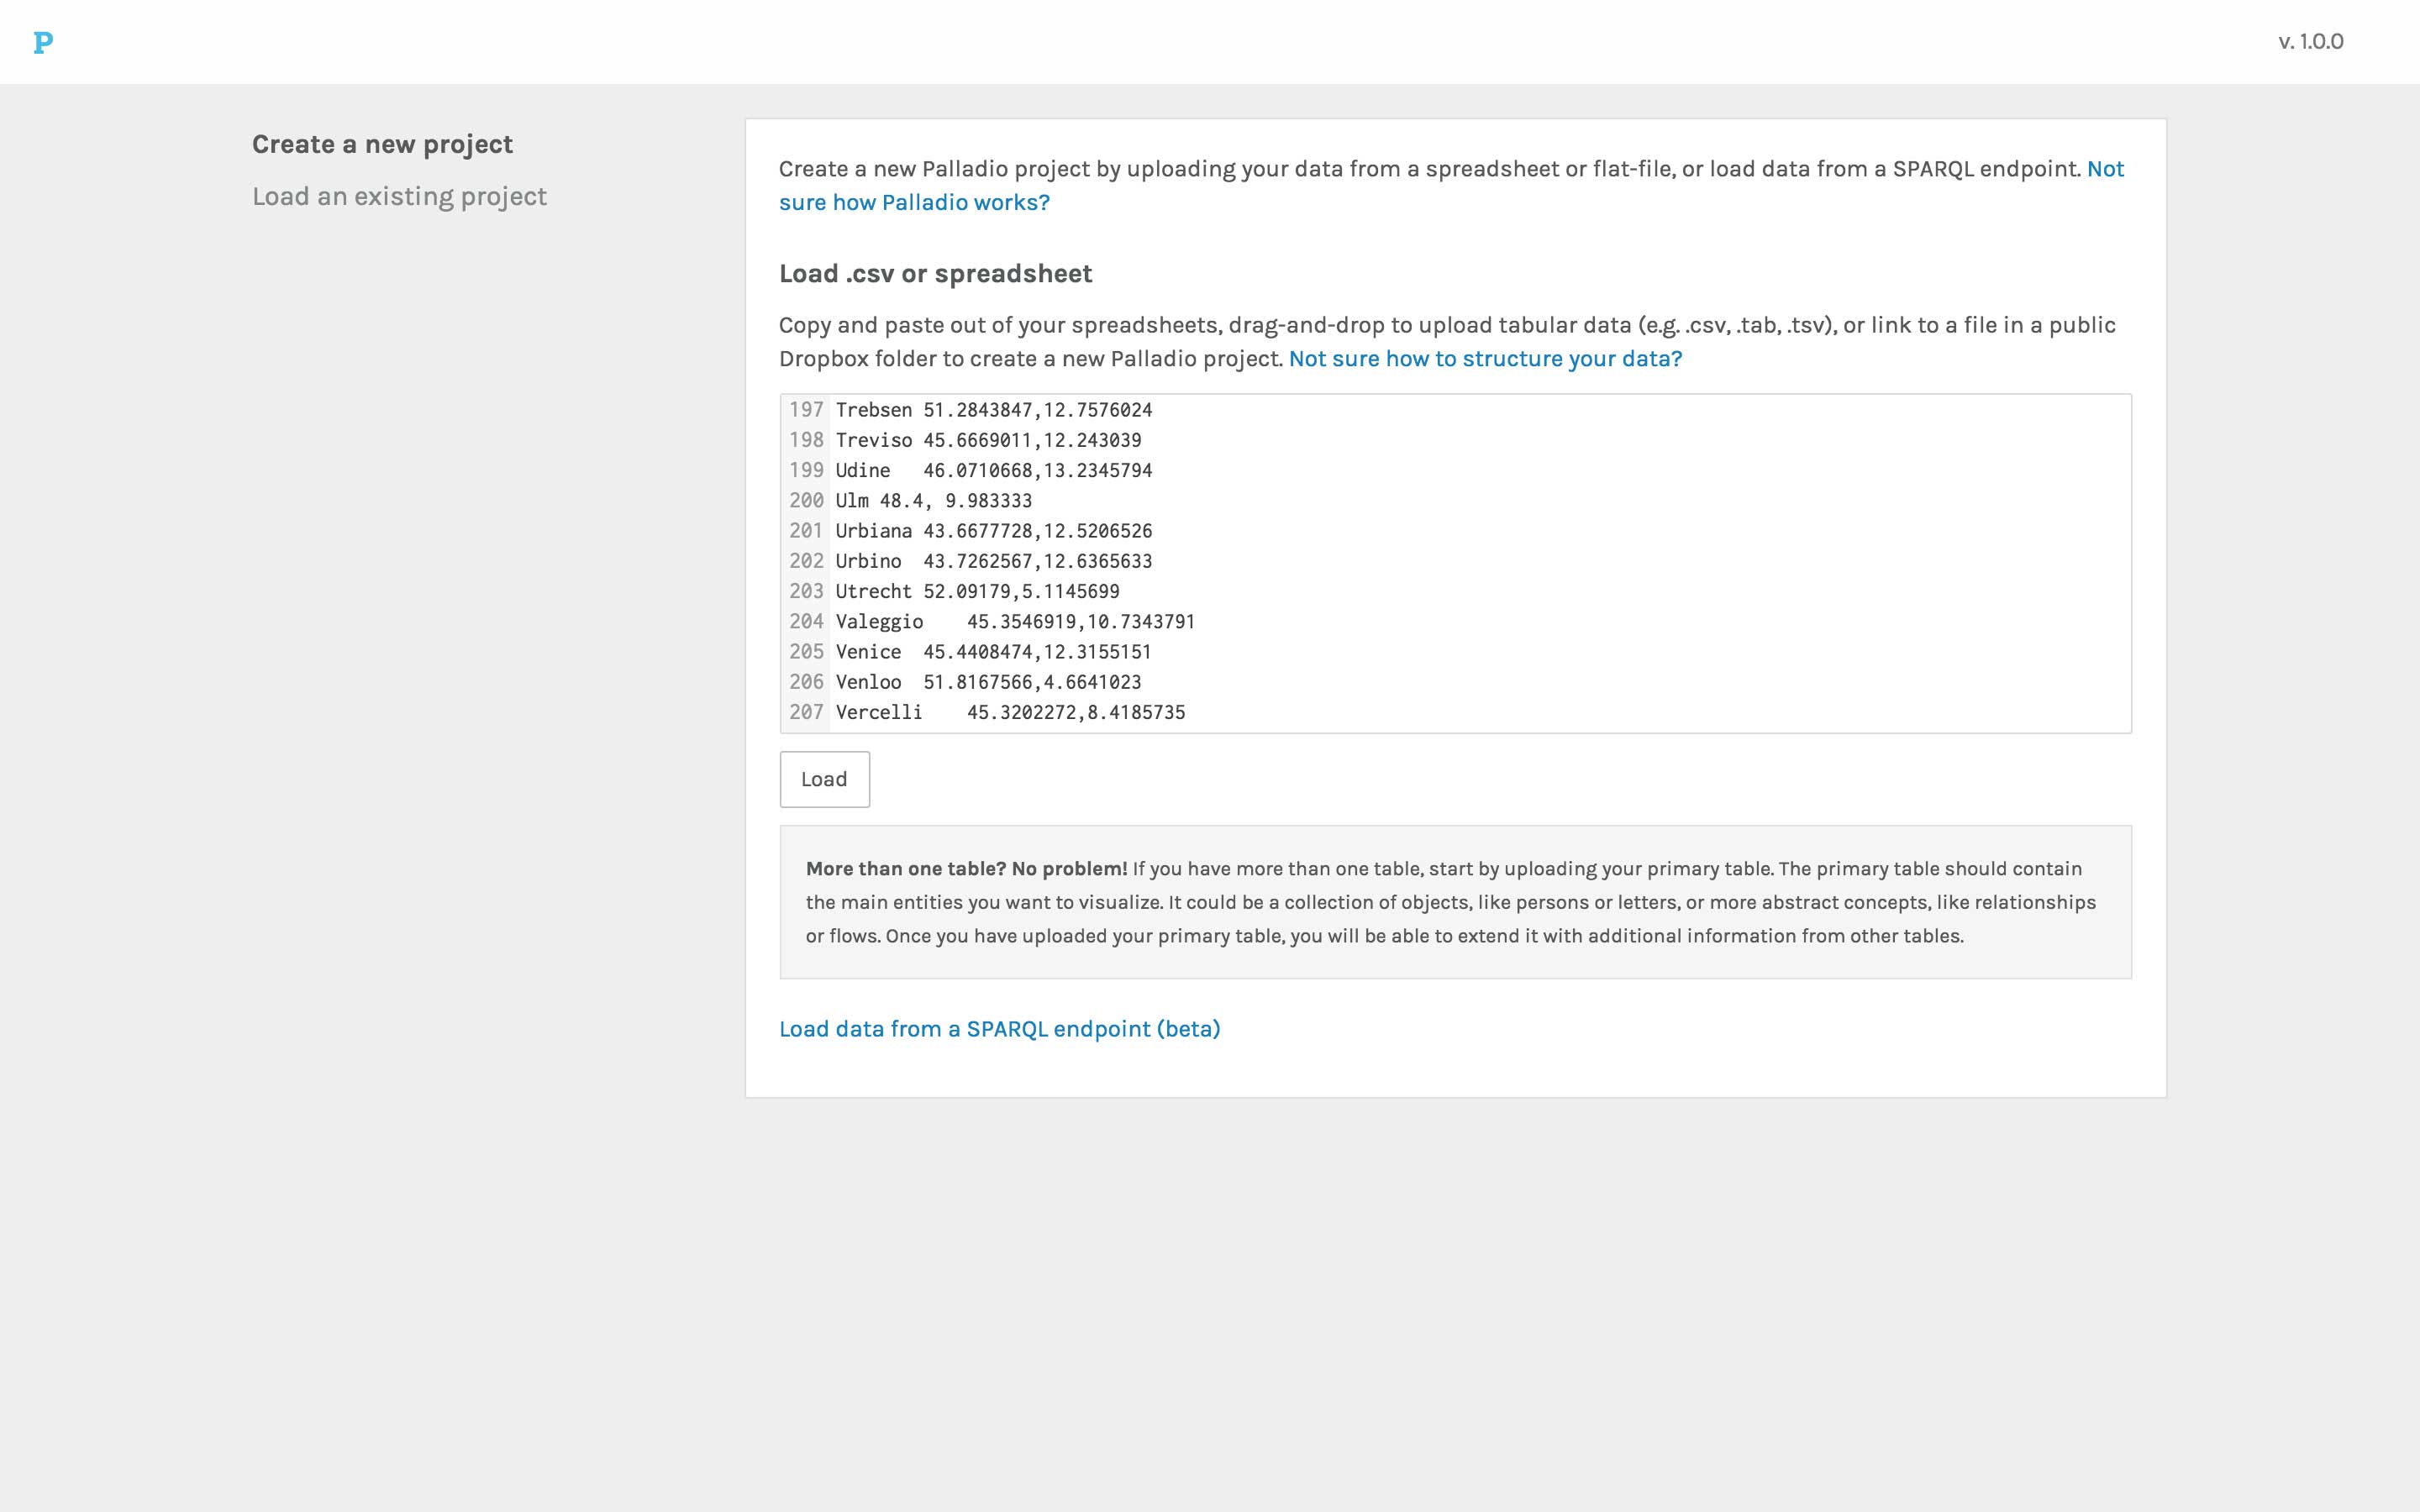
Create or Open Palladio projects
Copy and paste out of your spreadsheets, drag-and-drop to upload tabular data (e.g. .csv, .tab, .tsv), or link to a file in a public Dropbox folder to create a new Palladio project.
Visualize your data
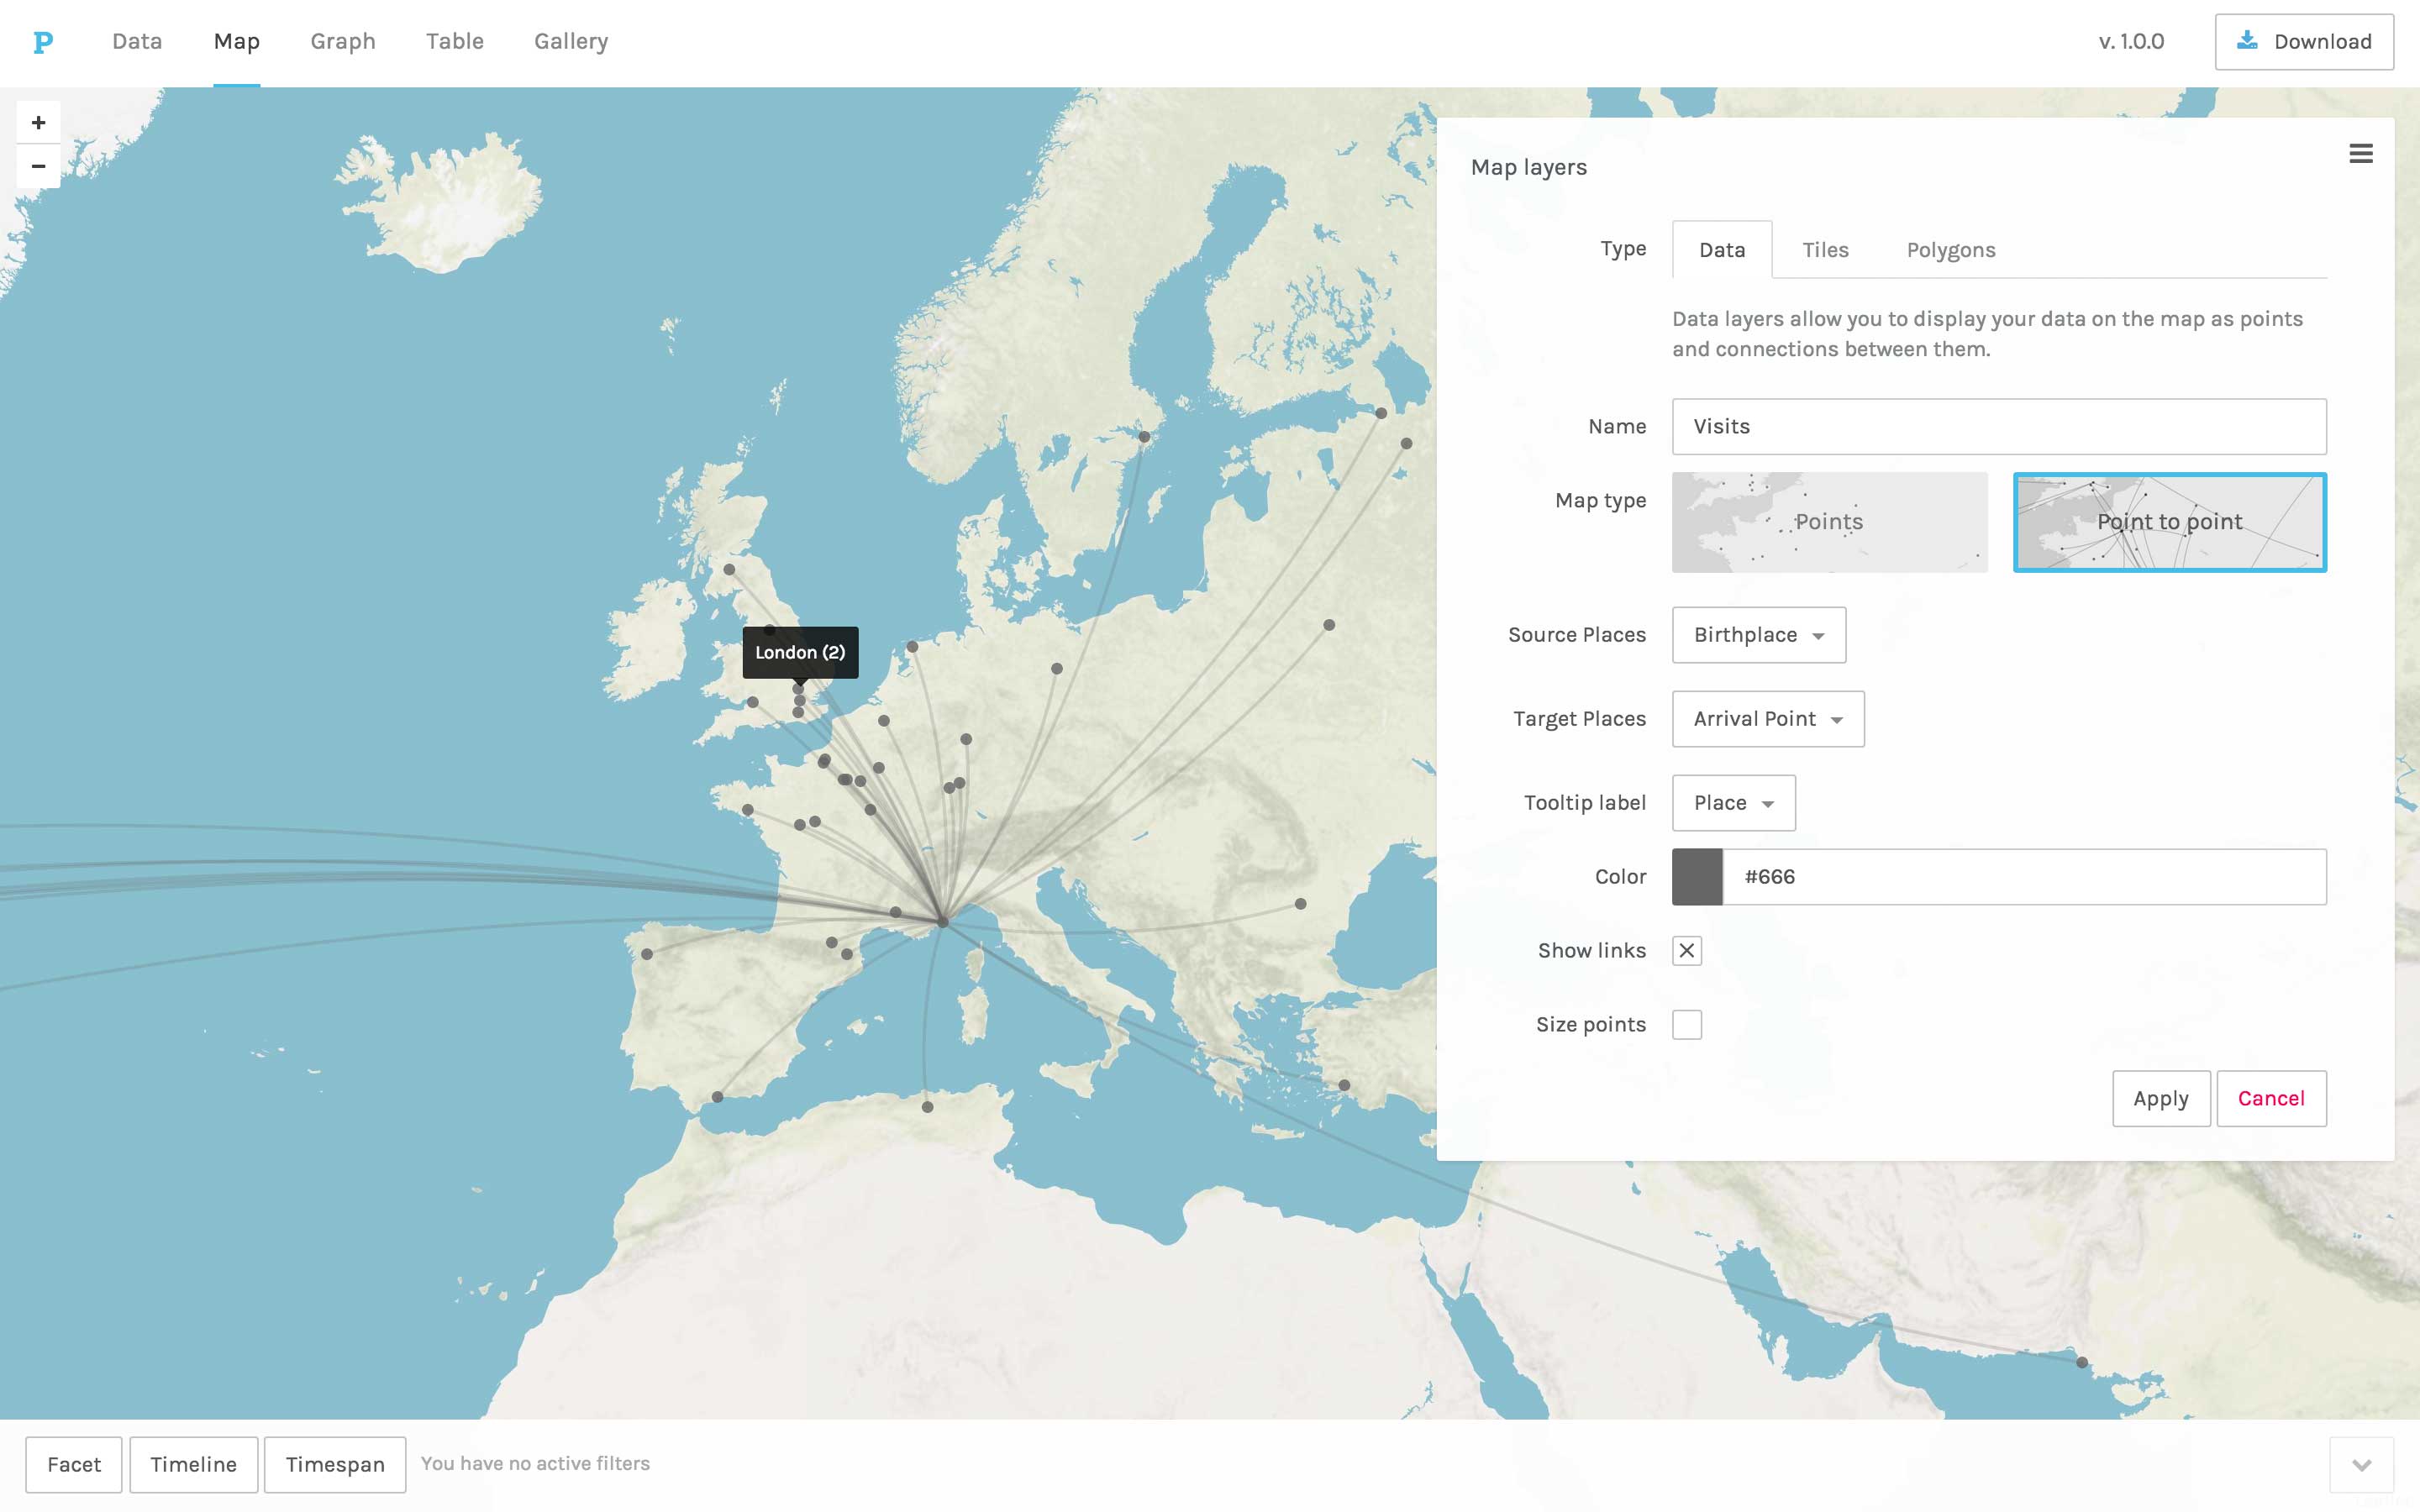
In the Map view, you can see any coordinates data as points on a map. Relationships between distinct points can be connected by lines, with the arc of the line representing the flow of the relationship.
Points on the map can be sized to represent their relative magnitude within your data. With the map’s tooltip function you can select which information will be displayed when hovering over a specific point on the map. Zoom in and out using the + and – buttons. Export the nodes and links of Map visualizations (though not the Map background itself) as .svg files.
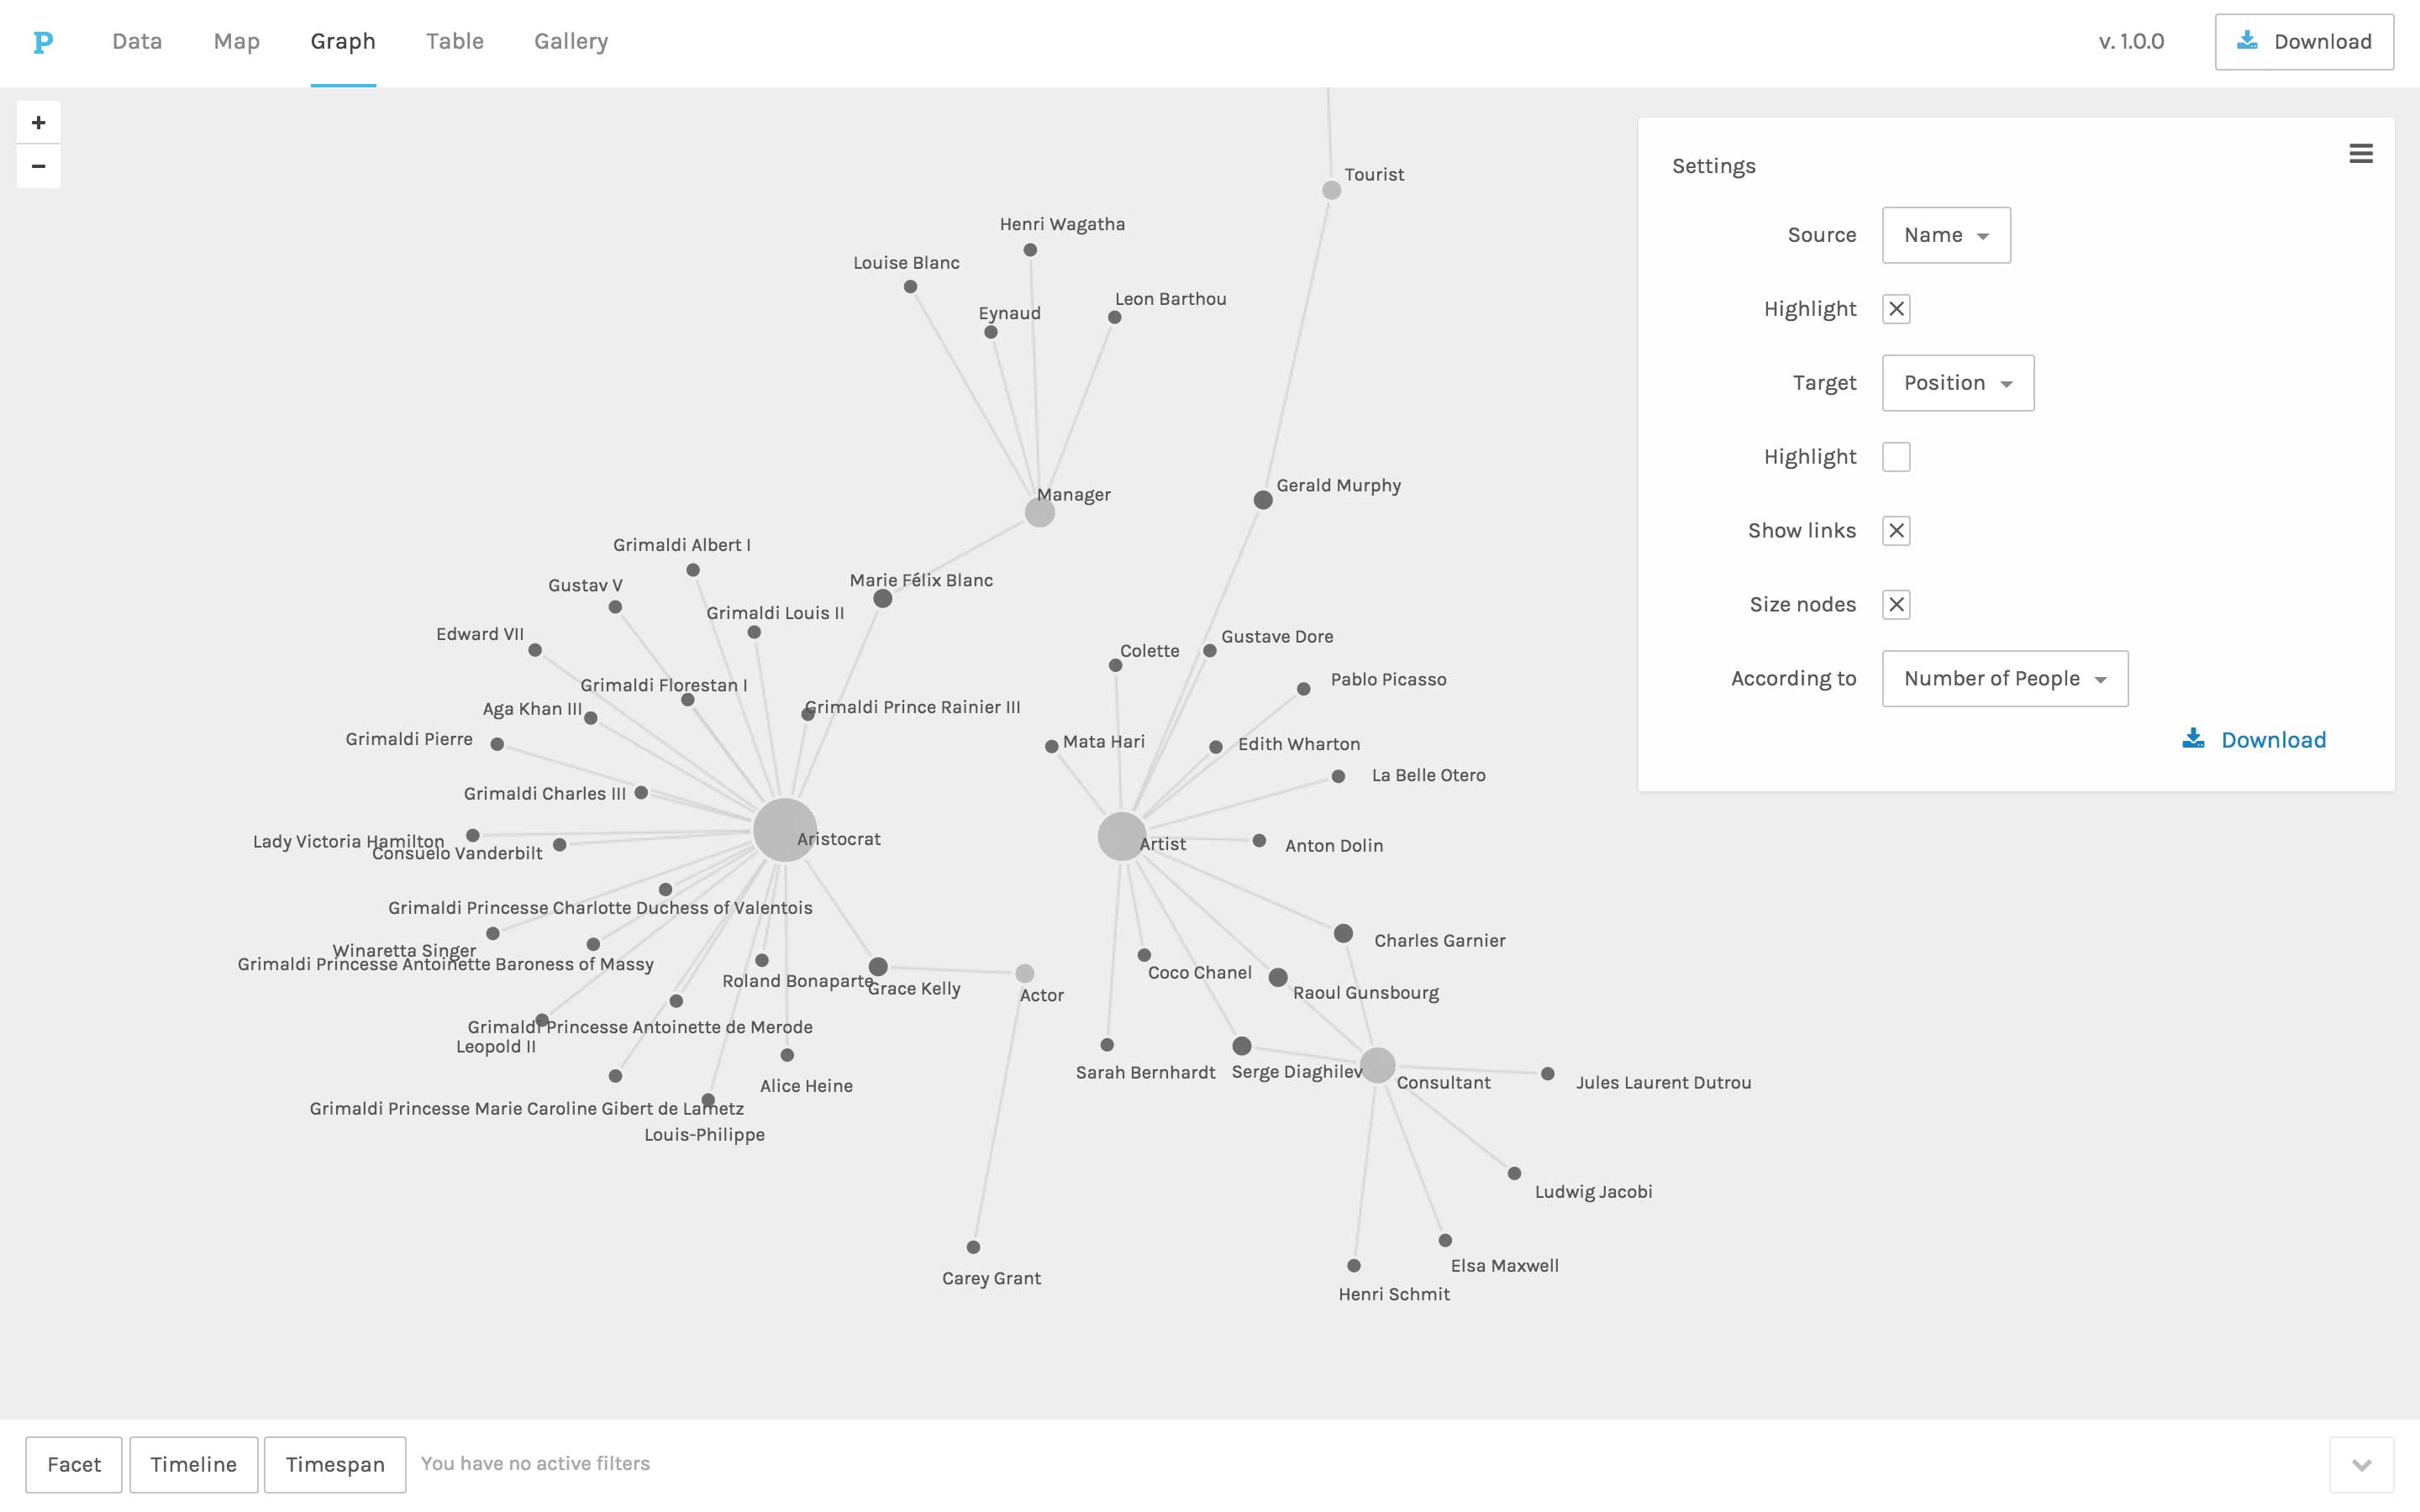
In the Graph view, you can visualize the relationships between any two dimensions of your data. Graph information will be displayed as nodes connected by lines. Nodes can be scaled to reflect their relative magnitude within your data. The display of links and labels can be toggled on and off. Export Graph visualizations as .svg files.
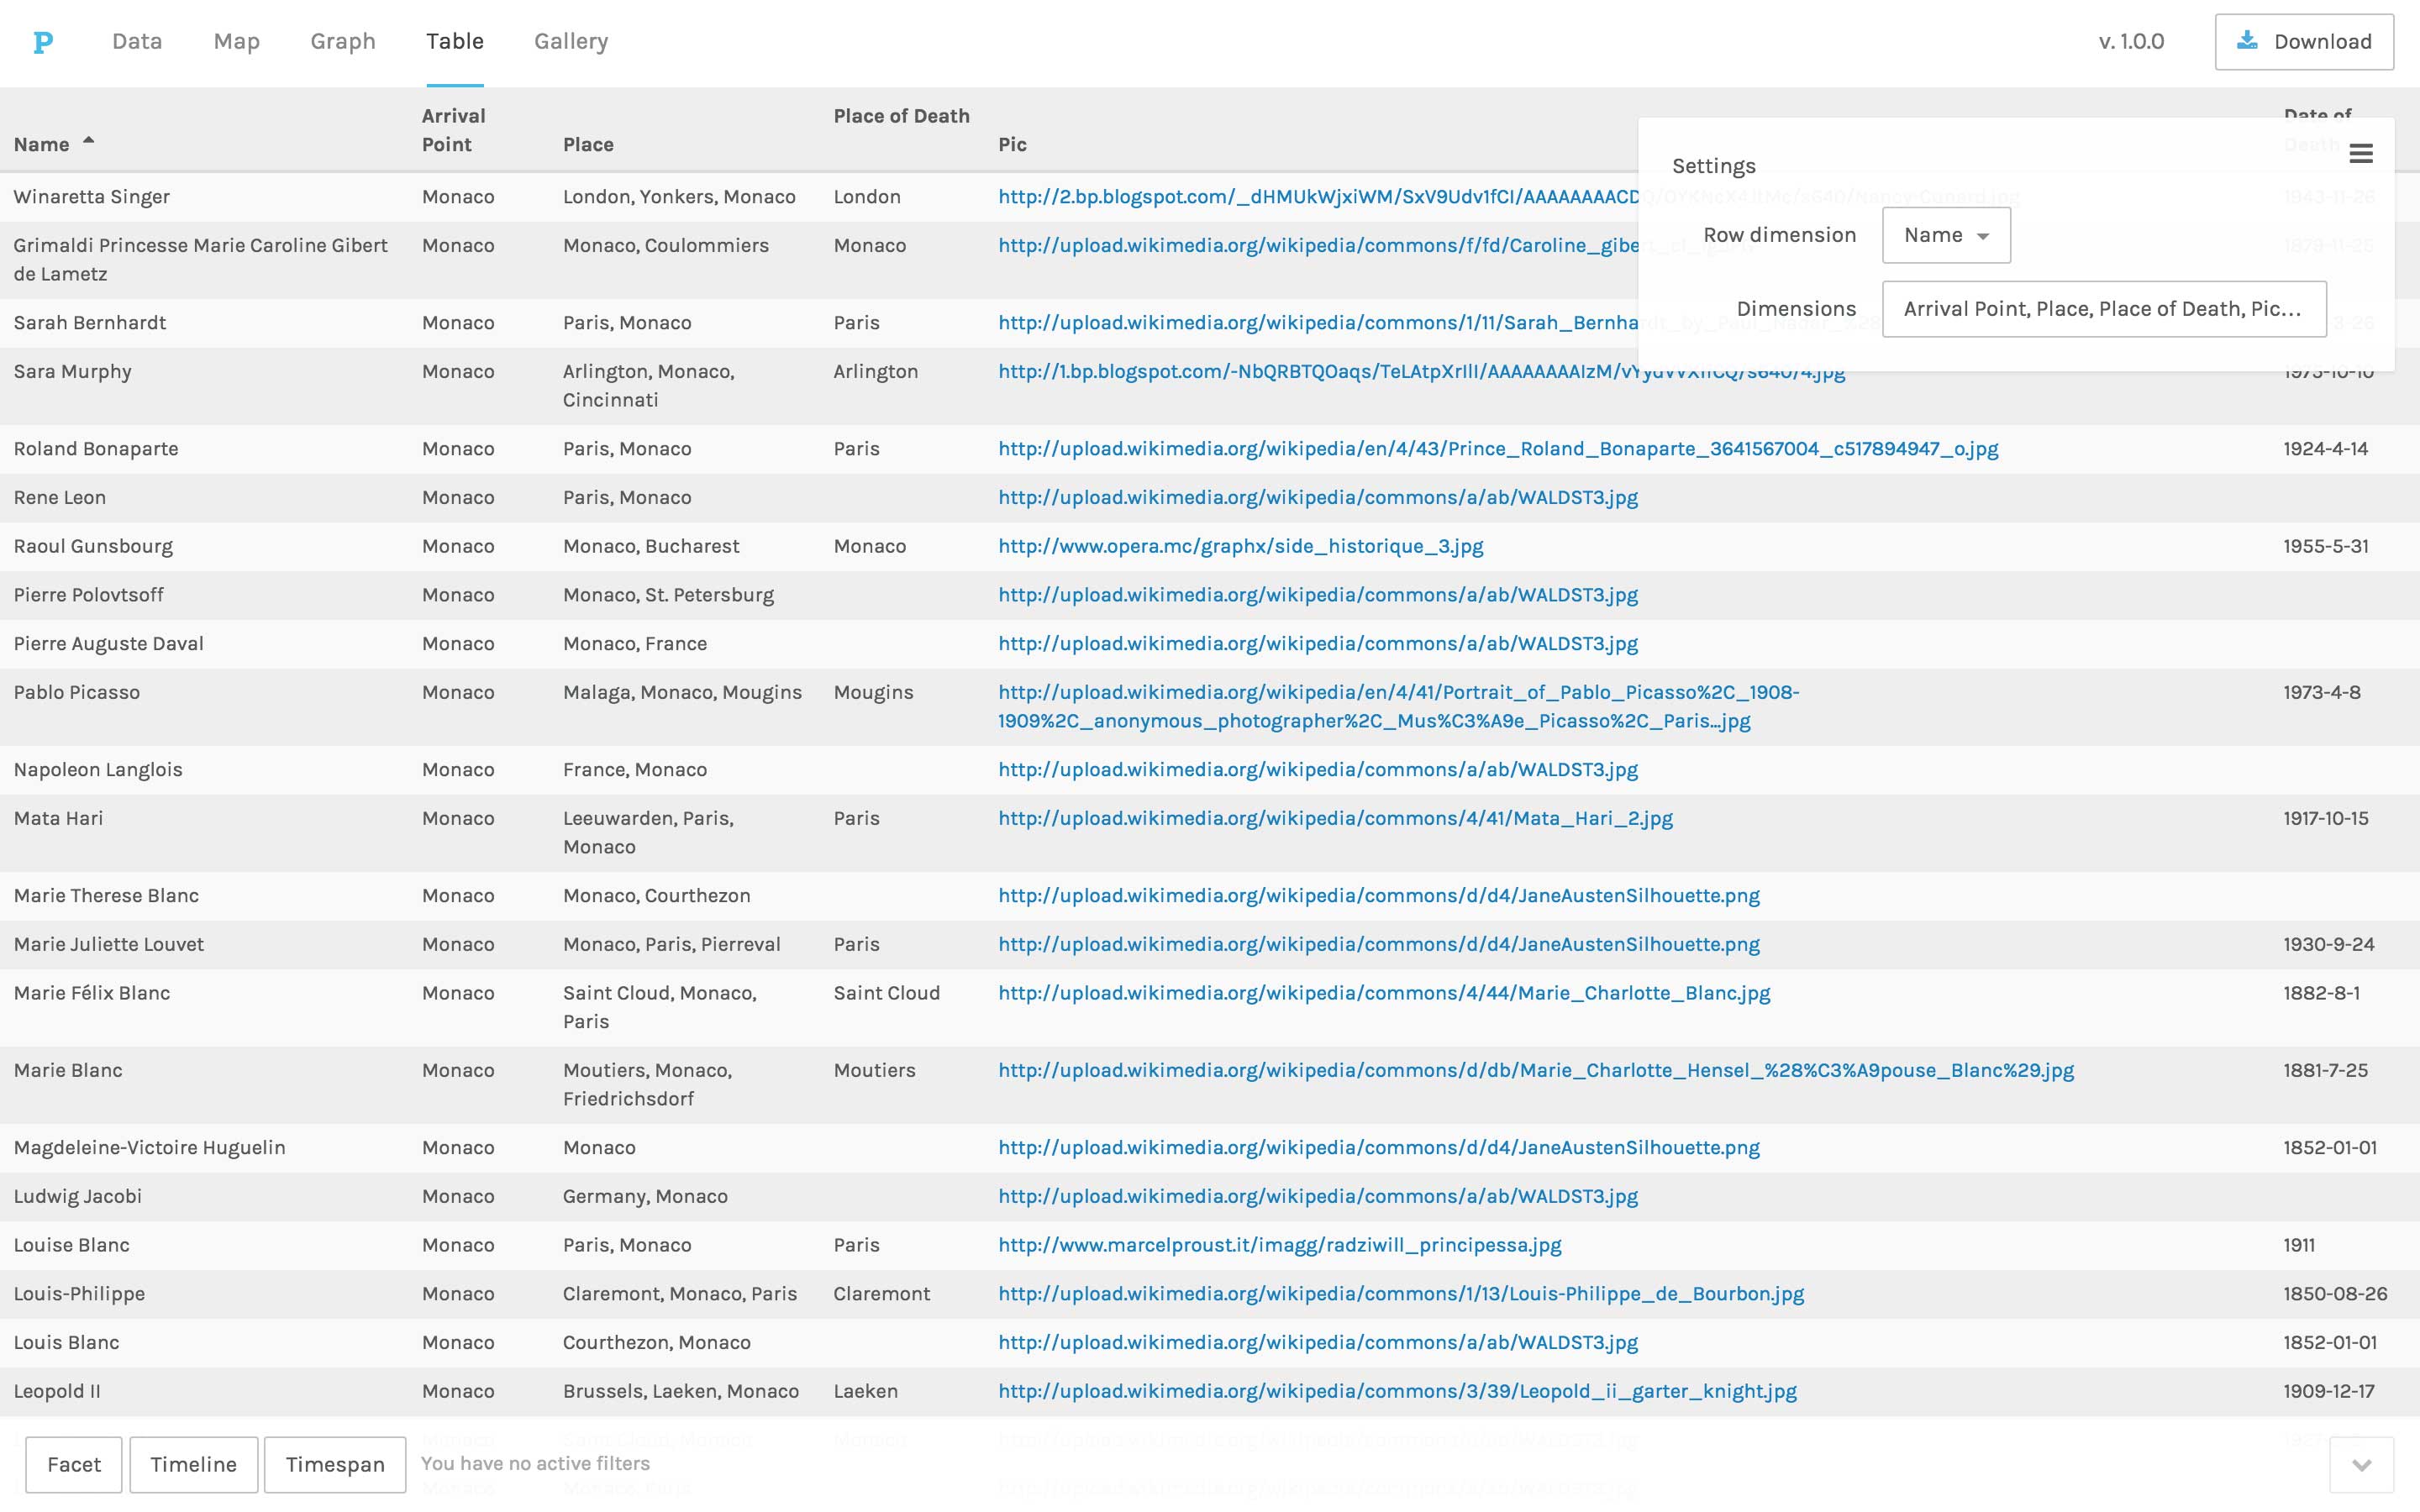
In the List view, dimensions of your data can be arranged to make customized lists. Export List visualizations as .csv files.
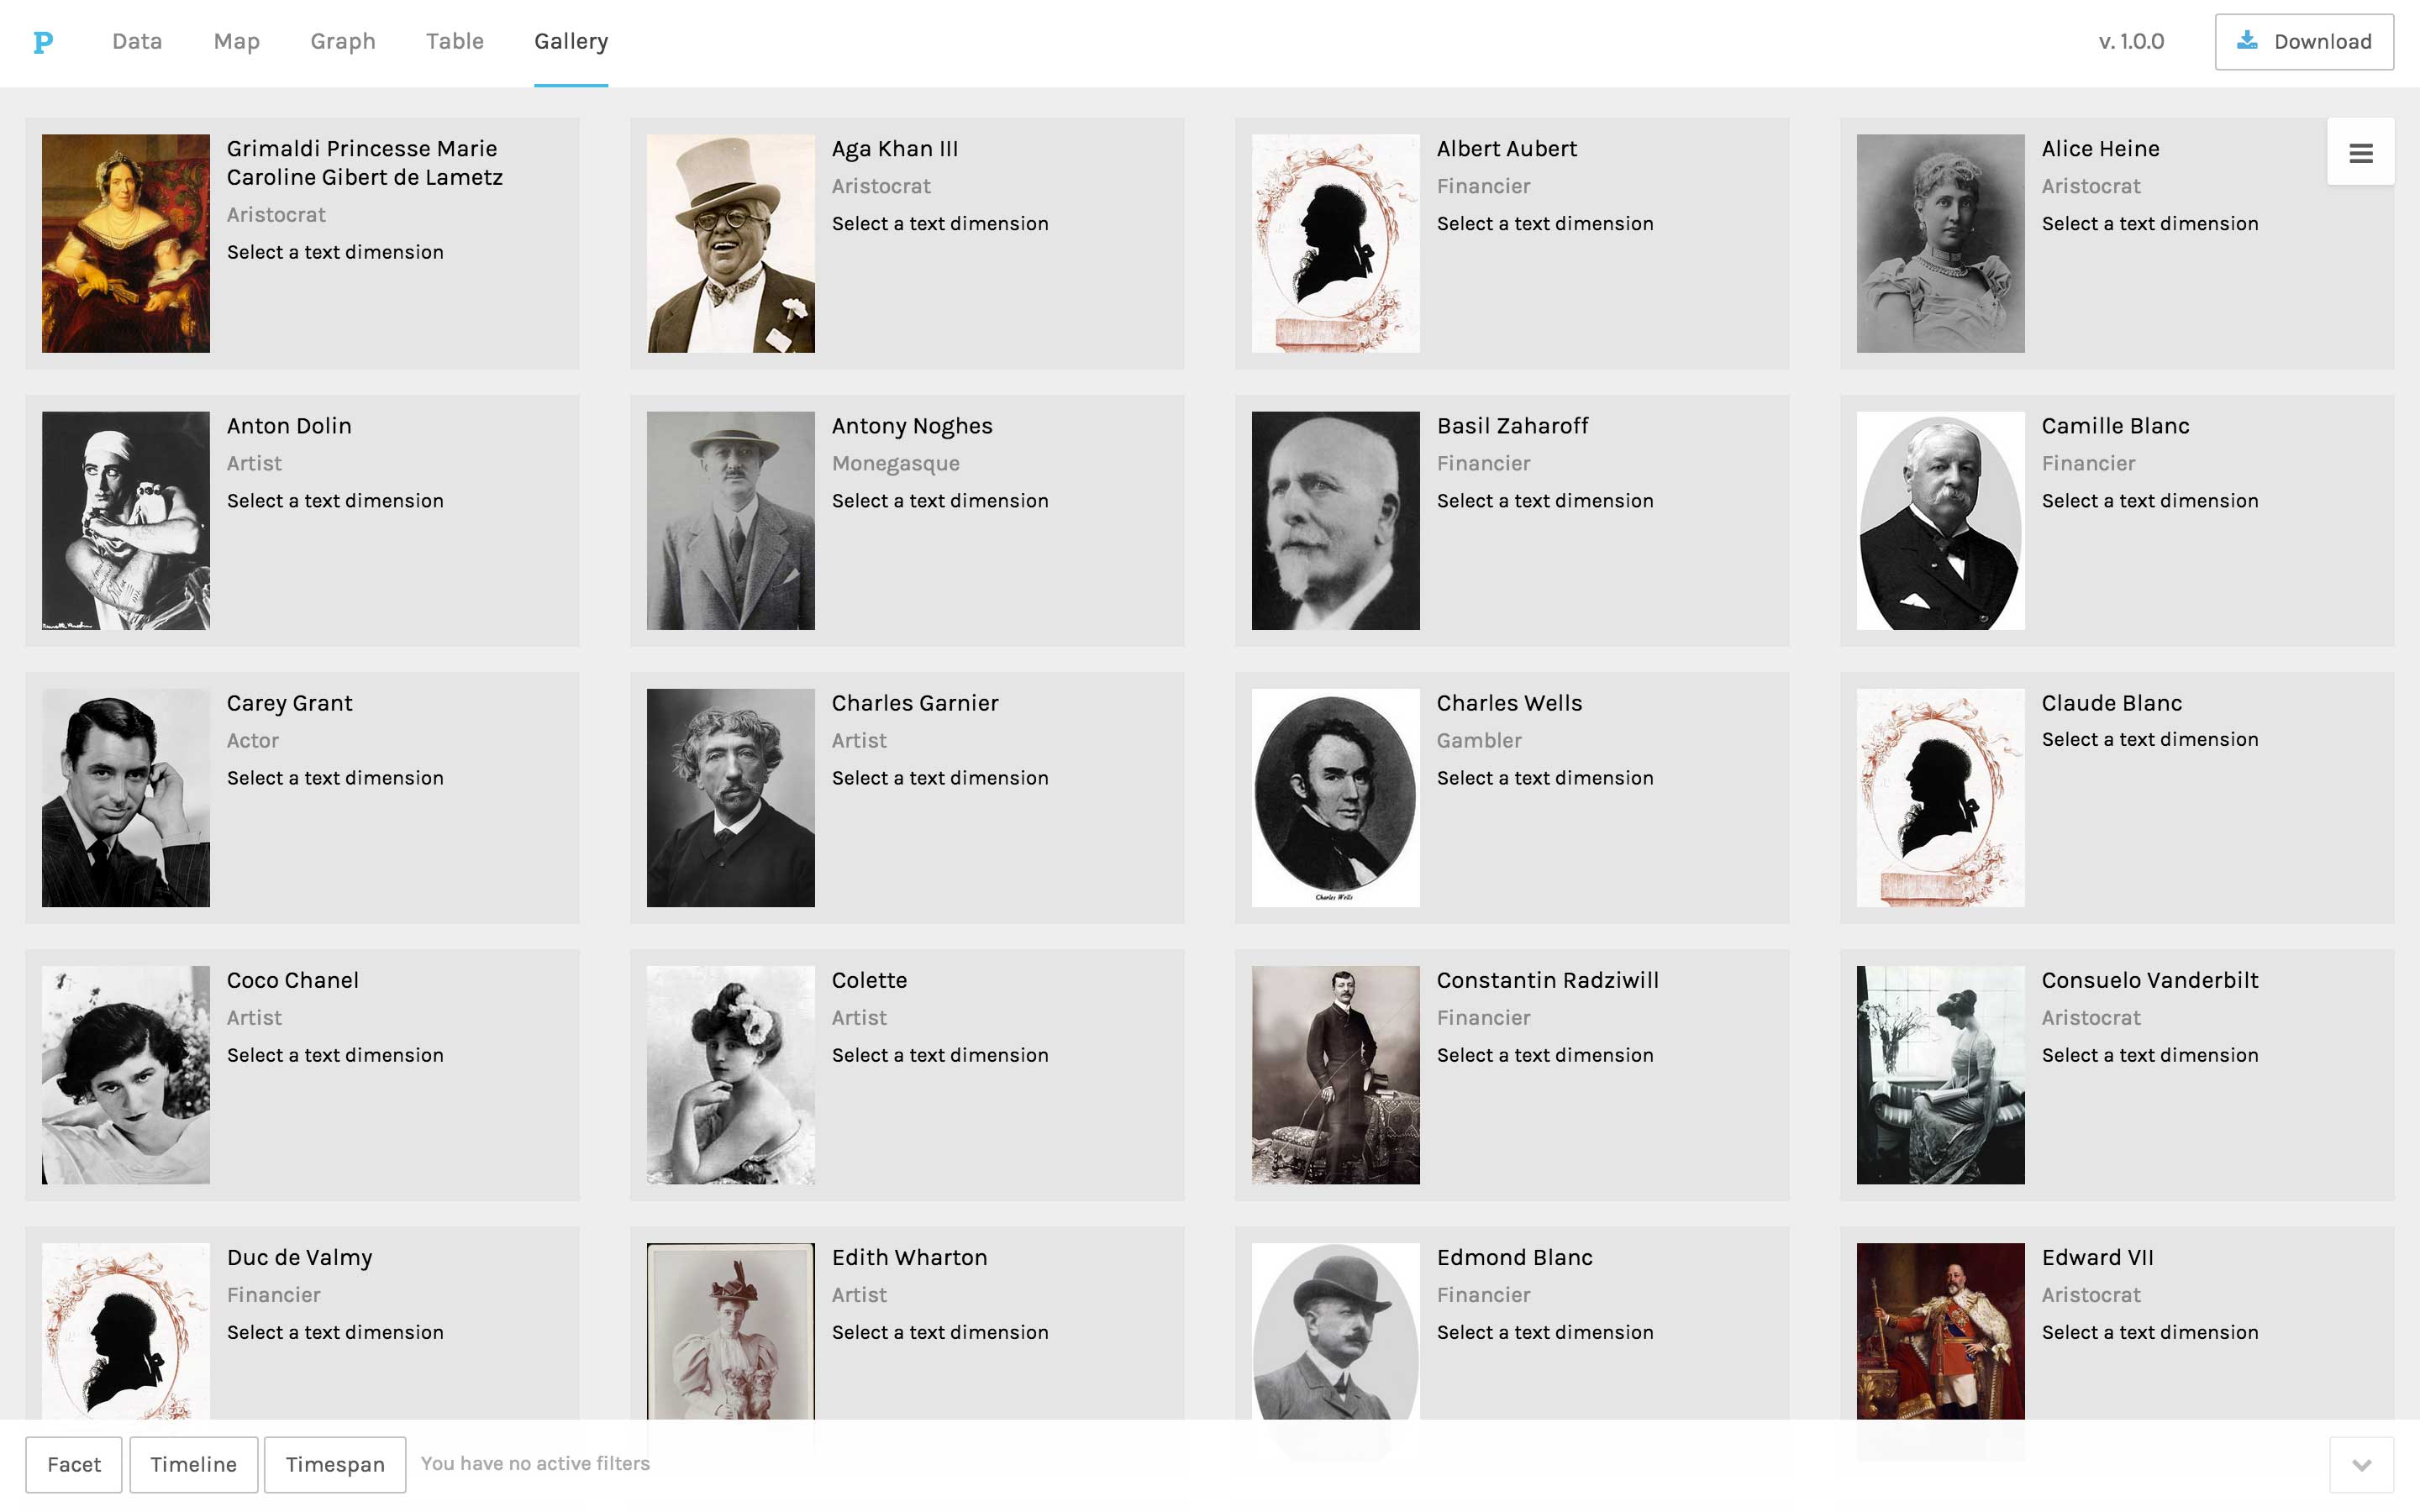
In the Gallery view, data can be displayed within a grid setting for quick reference. Here dimensions of your data can also be linked to outside web-based information. Sort your data according to different dimensions.