Create a Bivariate Graph
Palladio offers a bivariate graph to show associations between two different dimensions. The default is a simple force-directed layout. The strength of Palladio in investigating these associations comes with pairing the graph view with our different filters.
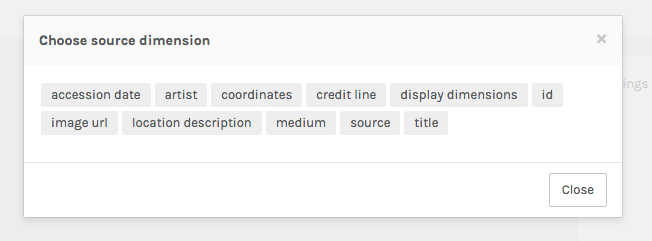
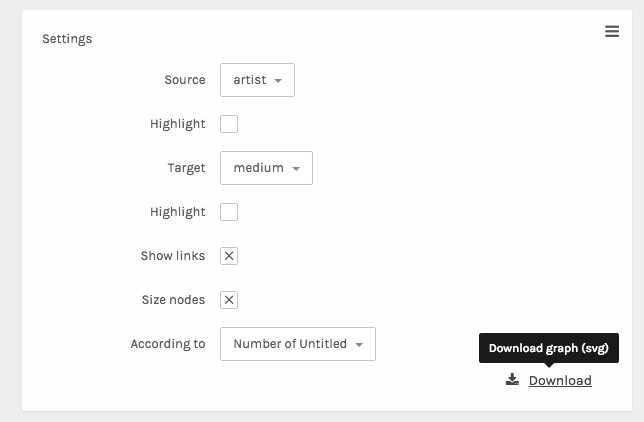
Any of your data dimensions can become a source or target dimension for the graph.
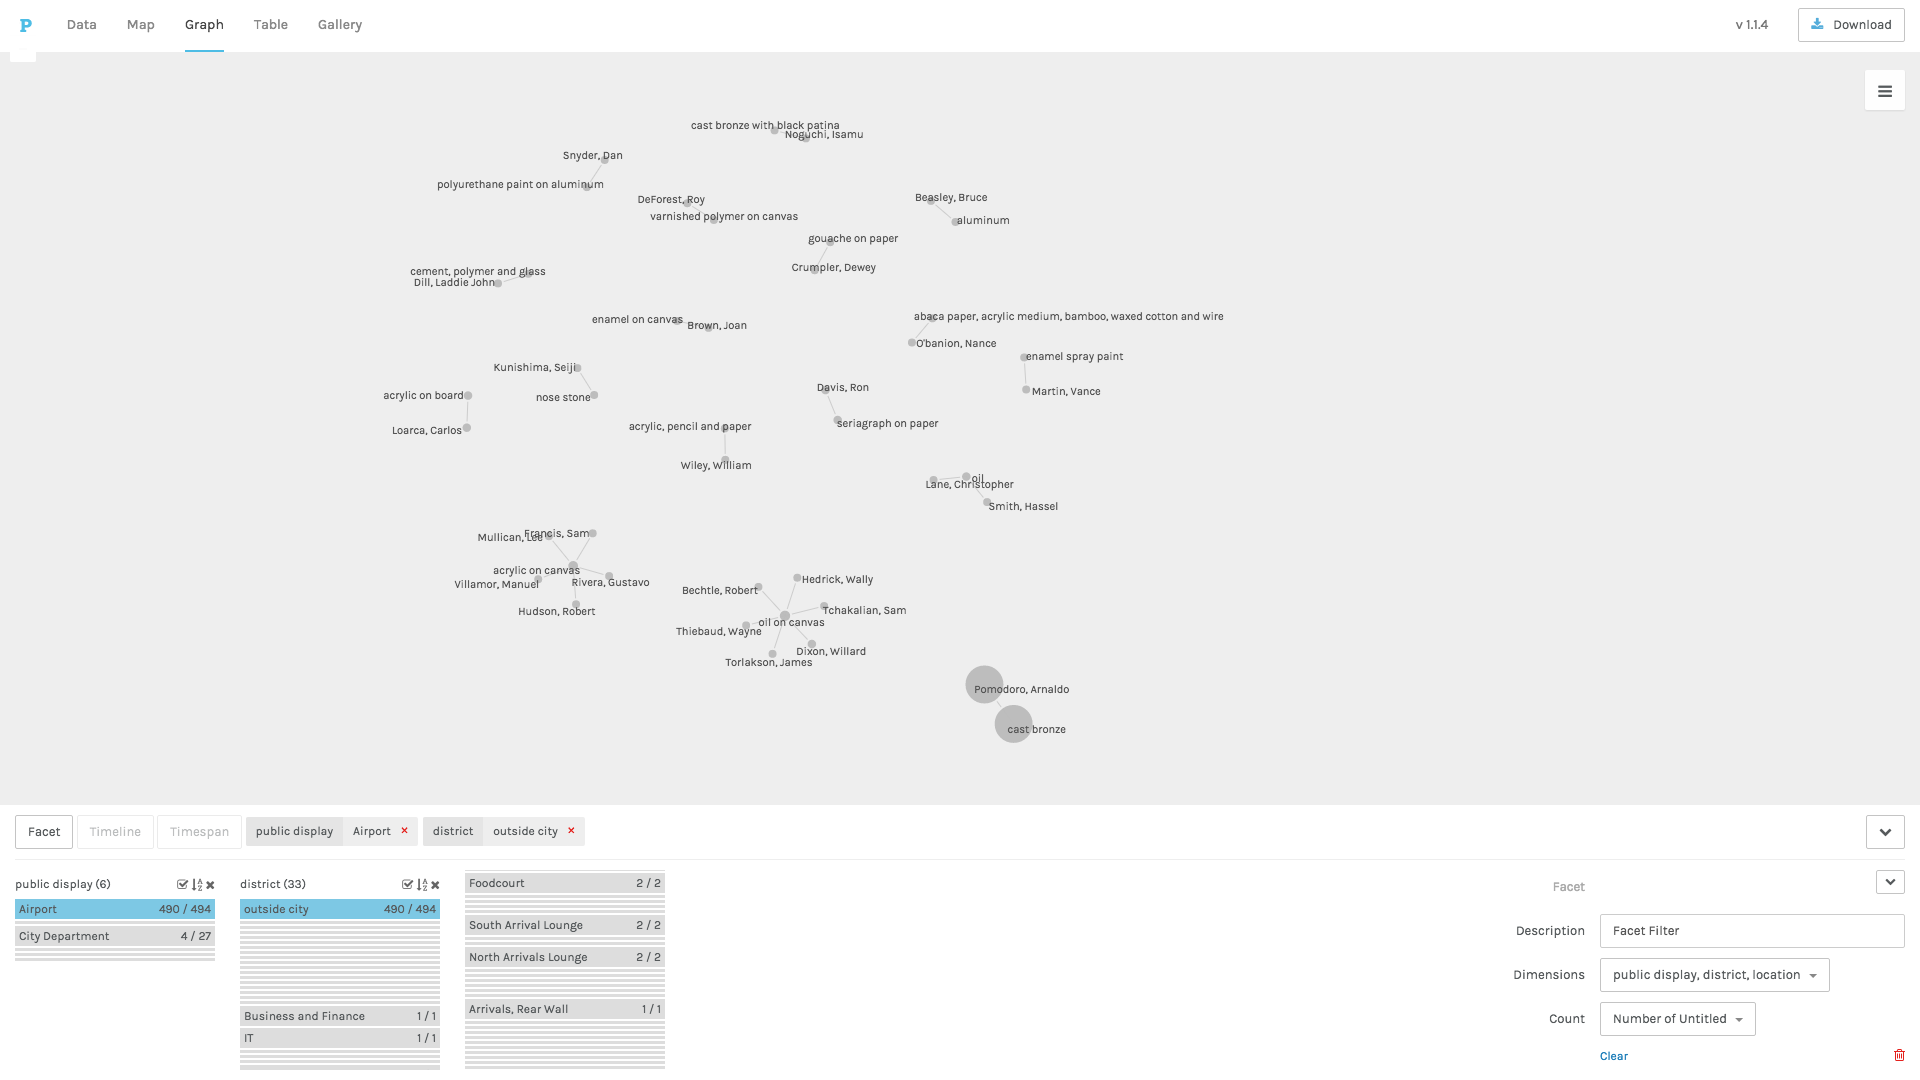
Graphed data looks like this.
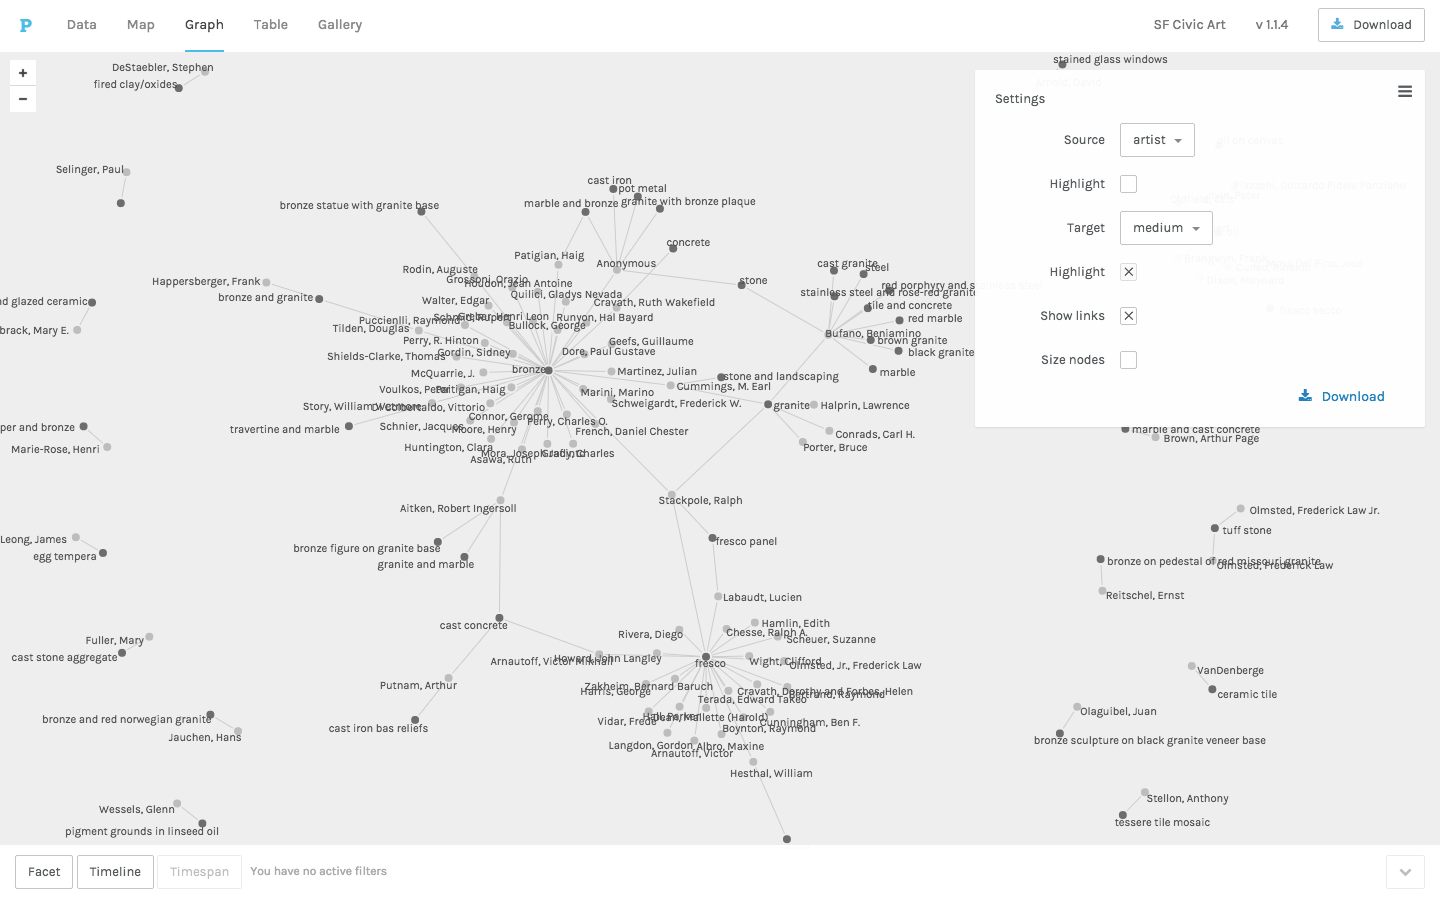
In that example, the darker nodes belong to the target dimension (medium) because the Highlight box is checked. Note that the nodes with more connections are by default more centrally oriented in the graph view and those with fewer or no connections are on the periphery.
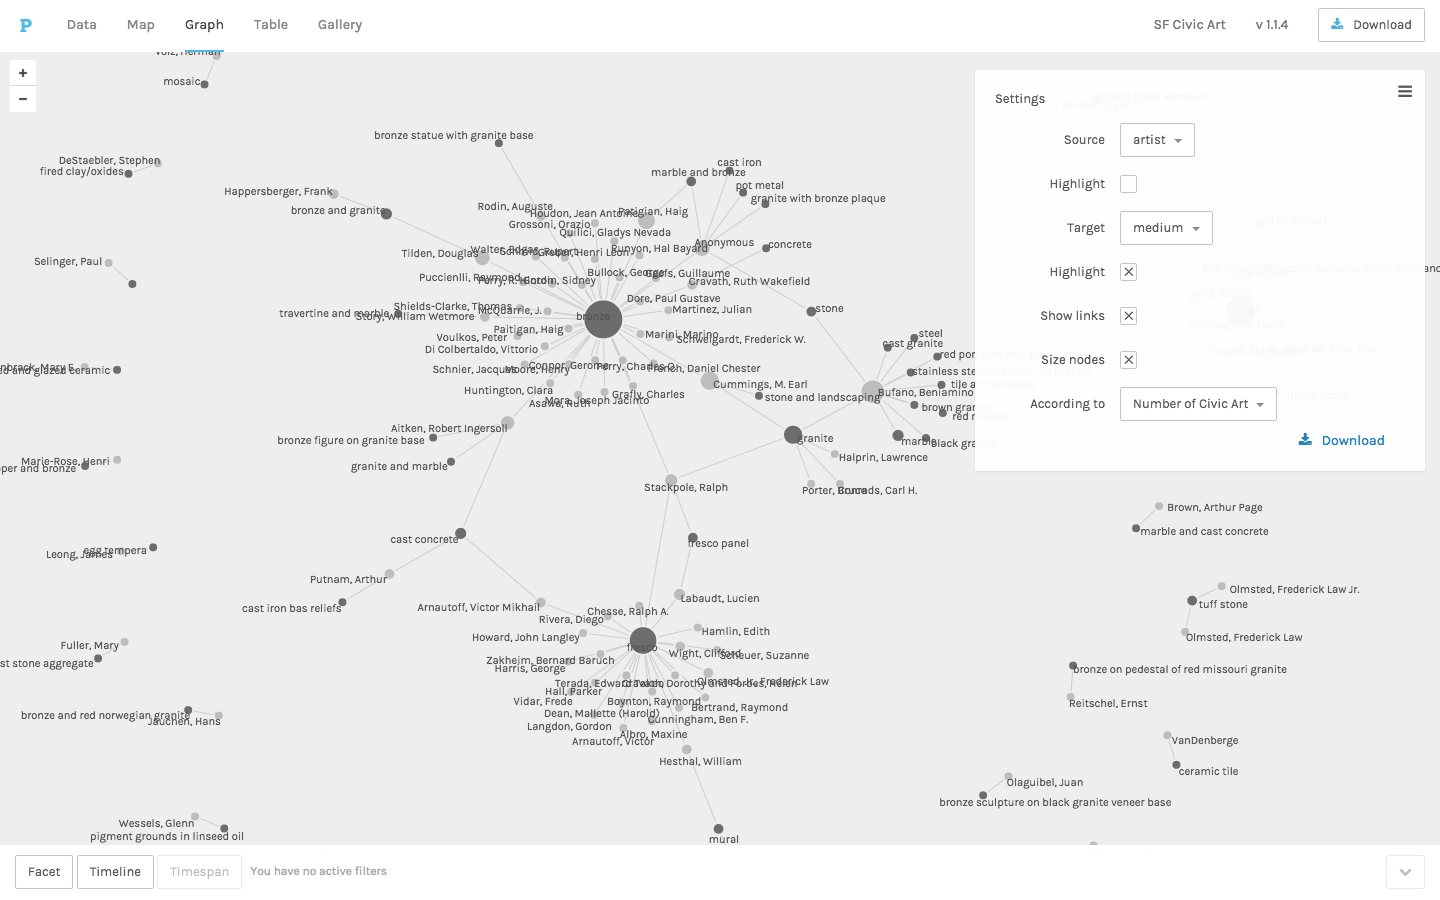
You can size nodes according to their connectedness in your data.
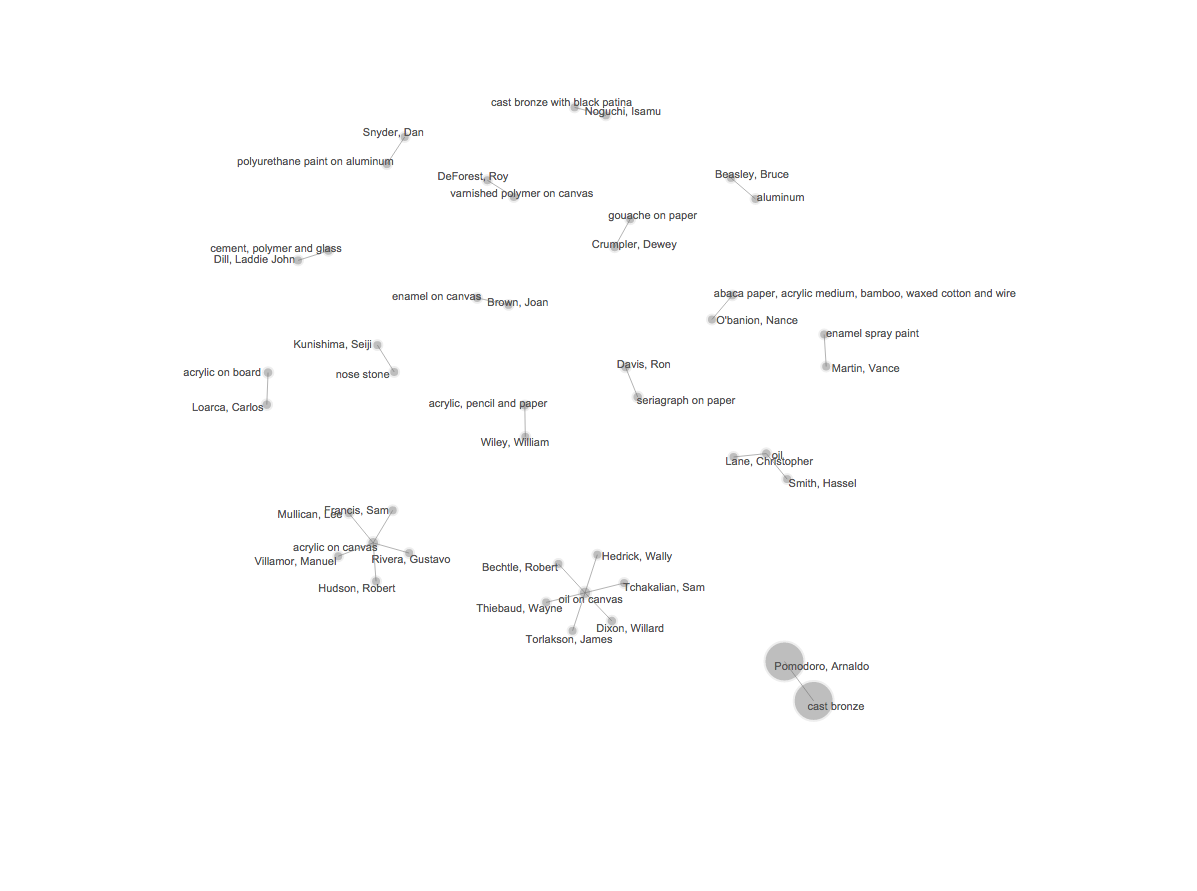
Orient your graph spatially by dragging and dropping nodes across the screen.
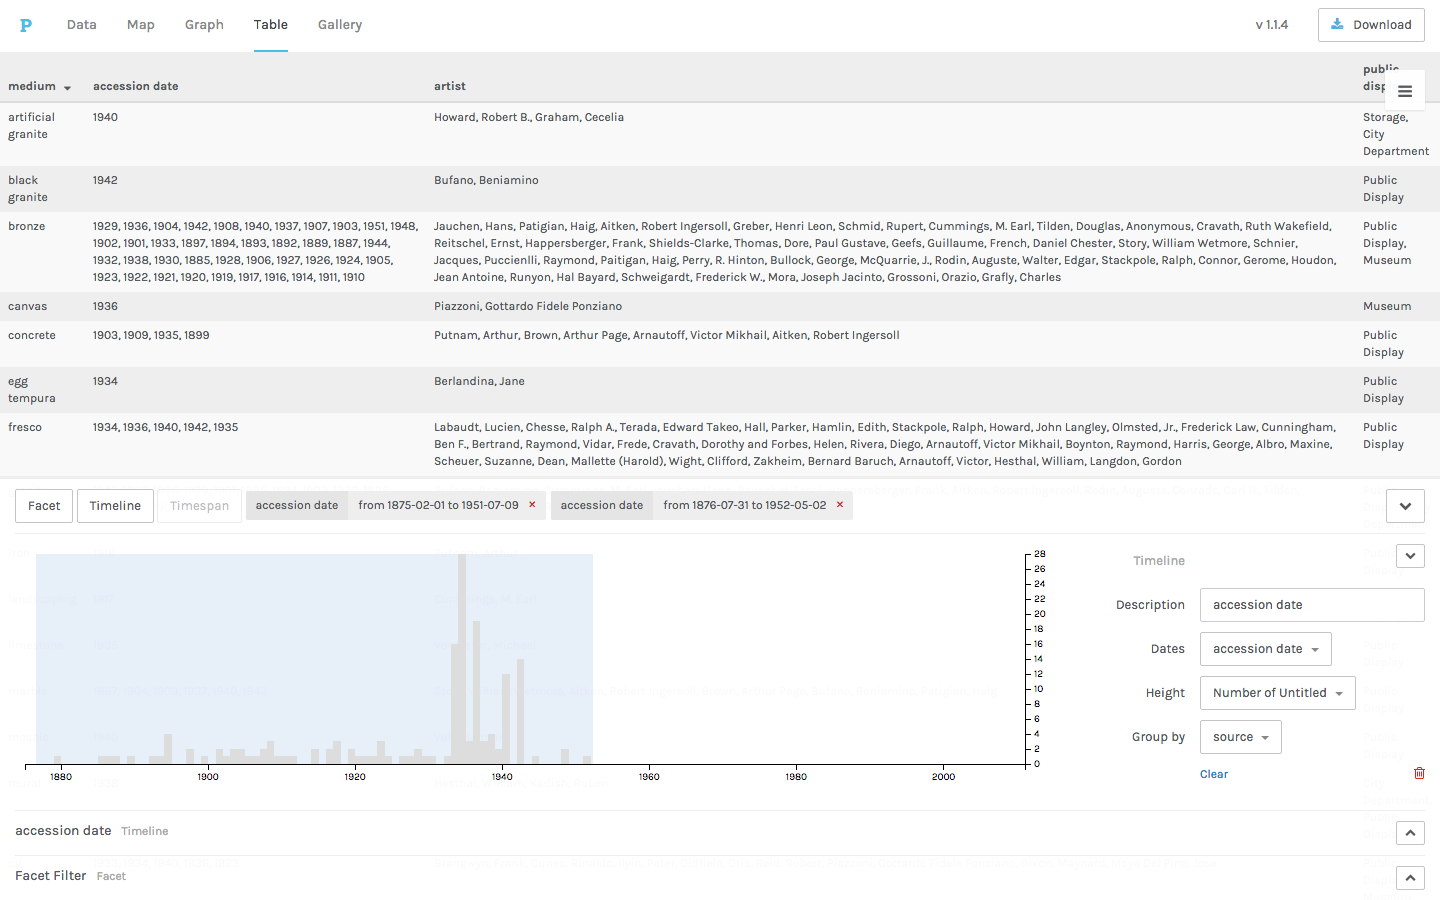
Investigate multiple dimensions of the data using interactive filters like the Facet Filter shown below.
##To learn more about using the Timeline, Timespan, and Facet Filters, see our separate tutorials.
You can also visualize the growth of a single data dimension.
The filters that you apply carry over to other Palladio views.
To save your graph, download it as a .svg file.
Your .svg file can then be edited in a vector graphics editor like Adobe Illustrator or Inkscape.