Create a Facet Filter
A Facet Filter allows you to filter to a subset of your data. You may filter by any of the various dimensions within your data, though it’s usually best not to apply more than 4 elements in any single filter.
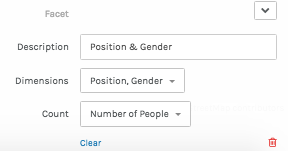
It’s possible to label each Facet Filter in the “Description” field. You select the dimensions to filter in the “Dimensions” field. The “Count” field will count your data points, or a number associated with them. (In this case, we are counting the “Number of People”. If we had an associated number data element like the “Number of Letters”, we could count those as well)
In this case, we are filtering based on the individuals’ position and gender. We can also delete the filter, or clear any selections already made.
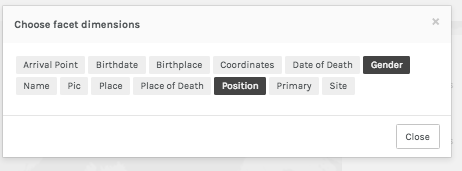
Clicking the “Dimensions” field lets us select from the dimensions in the data set. In this case, the “Position and “Gender” facets.
Once you have selected the dimensions to filter, you can narrow down your data by selecting specific elements. In this case, we are filtering down to Aristocrats, Financiers, and Authors. Note that as soon as an element is selected, the map or other visualization will update dynamically. Similarly, other facets show only the remaining data elements. In this case, our subset of Aristocrats, Financiers, and Authors leaves 30/50 Men and 11/23 Women.
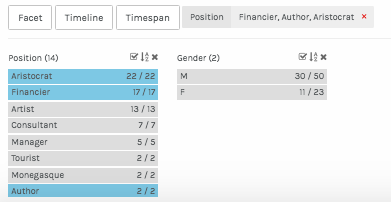
For each facet, you can also check to select all or deselect all, sort the selected elements, or remove one dimension from the filter.
A Facet filter will filter down to data elements that match ALL of the selected criteria (AND sorting). For more information on overlapping filters check the impact of overlapping filters.