Palladio Testimonial / Hannah Marcus
My name is Hannah Marcus and I am a PhD candidate at Stanford University where I study the history of Early Modern Europe. I am working with Professor Paula Findlen on a project called “Mapping Galileo” in which we are using digital humanities techniques to reconsider the correspondence network of Galileo Galilei. With the help of Kyle Lee-Crossett, we compiled spreadsheets to capture information about Galileo’s correspondence and correspondents.
I have been using Palladio to visualize the data we compiled and then to guide my reading and rereading of the primary source documents. Visualizations have drawn my attention to major trends that scholars have discussed for centuries and to surprising absences in the correspondence, which are serving as jumping off points for further research. One of my favorite aspects of Palladio is the ability to filter directly onto the visualization in real time. I can select, for example, to visualize only Galileo’s correspondents who were in religious orders, and then with a single click I can add all of his correspondents who studied at the University of Padua, and then I can select from the timeline to only include the letters that were sent after Galileo’s publication of the Starry Messenger in 1610. Interrogating the data quickly and from a distance helps me to return to reading the letters with a visual perspective of how the individual pieces fit into the “whole” of Galileo’s correspondence. In the coming months, our next steps will be to use Palladio to simultaneously visualize two data sets: the Galileo correspondence that exists in archives and the Galileo correspondence that no longer exists but is referenced in letters that have survived.
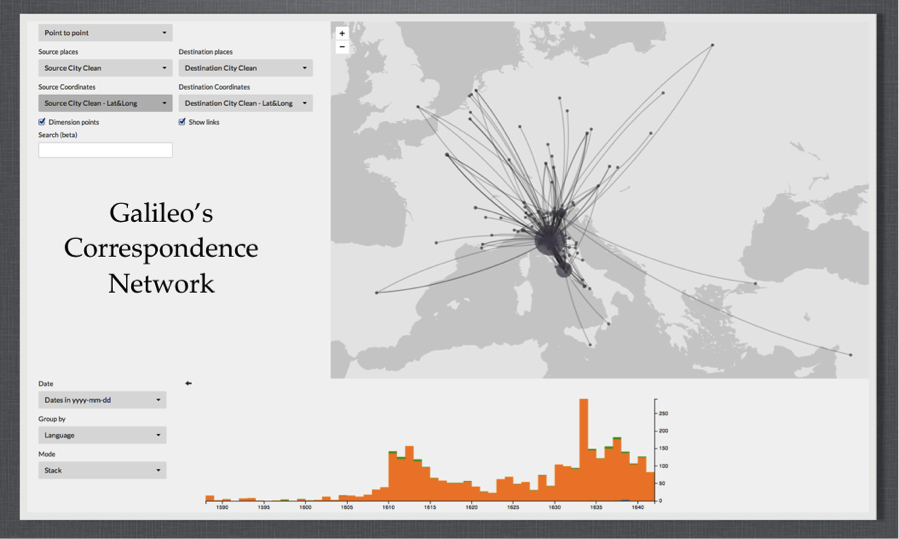
Image 1: A look at the “whole.” This visualization represents Galileo’s correspondence which is published in Antonio Favaro’s National Edition of Galileo’s works.
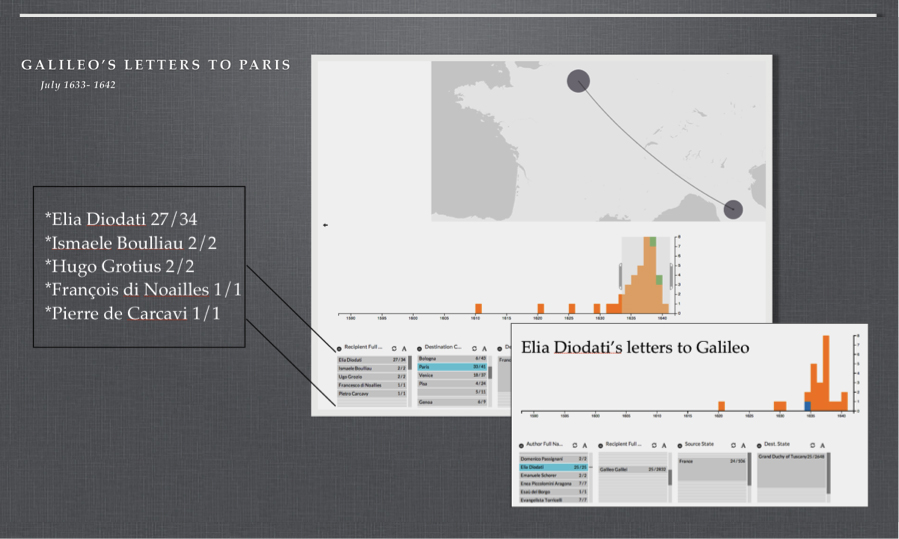
Image 2: An example of filtering: Here we visualized Galileo’s letters to Paris and compared it to his correspondence with Elia Diodati.