Palladio Testimonial / Maria Comsa
My name is Maria Teodora Comsa, and I am a Ph.D. candidate in French at Stanford University. I am writing my dissertation on French society theater in the 18th century under the guidance of professors Jean-Marie Apostolidès and Dan Edelstein. As a supplement to my dissertation, I have been compiling datasets cataloguing the people, locations, performances, and texts from society theater.
I use Palladio to visualize, explore, and augment the data that I compiled and this has proven very helpful in answering some of my research questions. What is unique about Palladio, is that it recognizes the types of data that I upload, and it allows me to view and edit the data before the visualization step. This means that I can easily correct minor errors, change formats, and most importantly, add value and hierarchy delimiters without modifying my initial source files.
Thanks to Palladio’s powerful visualization options, I can easily identify trends in my data that would not be evident otherwise. For instance, I can study the social composition of the network of people involved in society theater to see how many of the participants were part of the elite (aristocracy). I can then apply a facet filter and view only the aristocrats who wrote plays… and were female. Palladio dynamically updates the different views so that I can see the results of my query on a map, in a network graph, in a table, or as a grid of images. The graph view is my favorite; it is extremely powerful because it does not restrict which values I can use as source or target, which empowers me to explore my data in ways that I had not anticipated.
Visualizing data helps me better understand the specificity of society theater and allows me to identify which aspects will be interesting to analyze next. Using Palladio, I can query not only my own data, but I can connect it to other data sets (like those compiled for the Mapping the Republic of Letters project) and explore how the society theater participants fit within the larger Enlightenment networks.
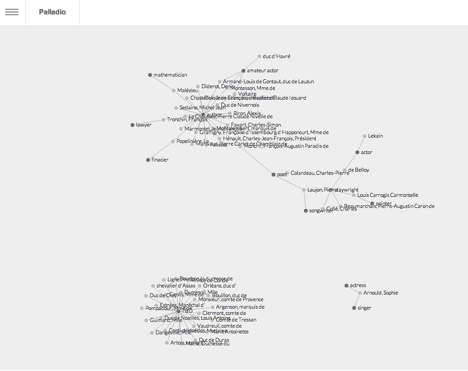
Image 1: Network graph view of society theater participants by occupation.
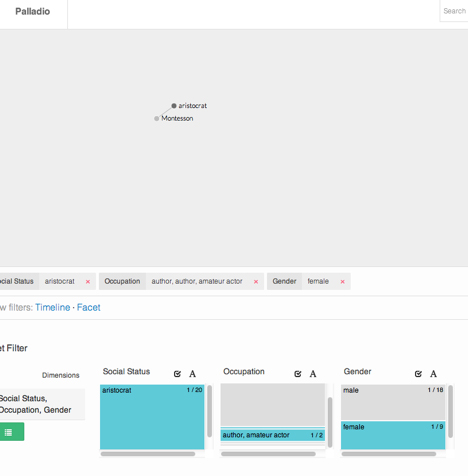
Image 2: Graph view of society theater participants filtered by social status, occupation, and gender.
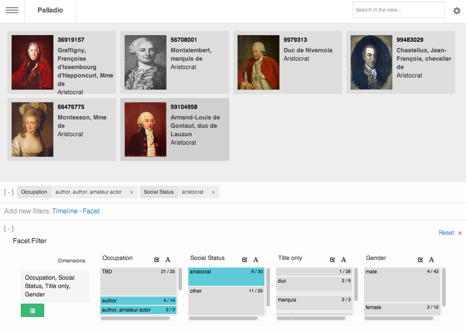
Image 3: Grid view of society theater authors by social status.
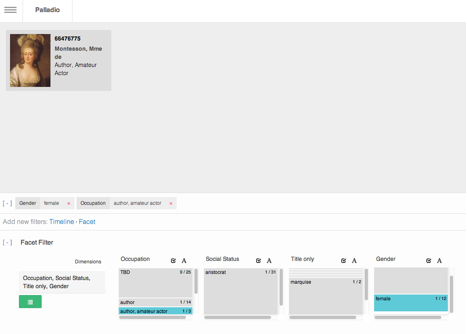
Image 4: Grid view of society theater participants filtered by social status, occupation, and gender.