Create a Timeline Filter
A Timeline Filter allows you to filter to a subset of your data. You may filter by any data elements associated with dates, and can filter by one or more sets of dates.
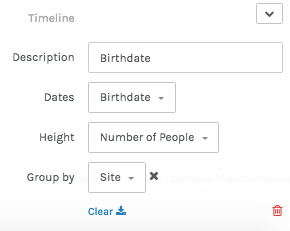
It’s possible to label each Timeline filter in the “Description” field (the default is the first “date” element in your dataset). Choose the date to filter in the “Dates” field. The “Height” indicates what to count for the height of each bar in the timeline. (In this case, we are counting the “Number of People”. If we had an associated number data element like the “Number of Letters”, we could count those as well) Data in the timeline can be further grouped by a particular element in the data set, or the grouping can be cleared (the default is to group by the first element in your dataset).
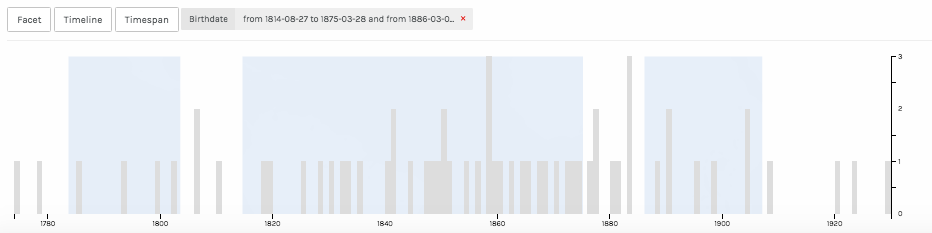
After selecting the dates to filter by, you can select subsets of the data by clicking & dragging to highlight. Highlighting and selecting the data will update the map or other visualization dynamically. After making a selection, you can select additional date ranges or move the subsets around.
For more information on overlapping filters check the impact of overlapping filters.