Visualize table data
Palladio allows you to (re)create a table view of your data, adding any number of dimensions (columns) and download the data afterwards.
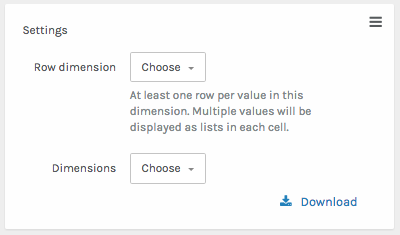
When you first move to the Table view, you are prompted to select a row and any number of dimensions.
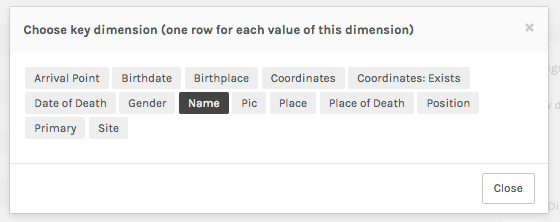
First, select your row - this is your key column, and one row will appear for each value in this dimension.
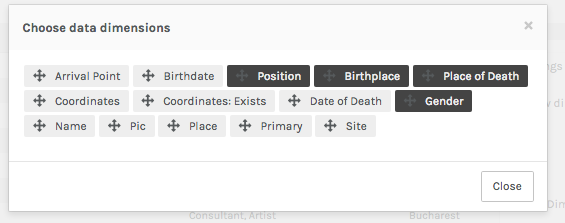
Next select any number of columns (you can also drag values around to change the order the columns will appear). If multiple values exist per row, all will be shown seperated by commas.
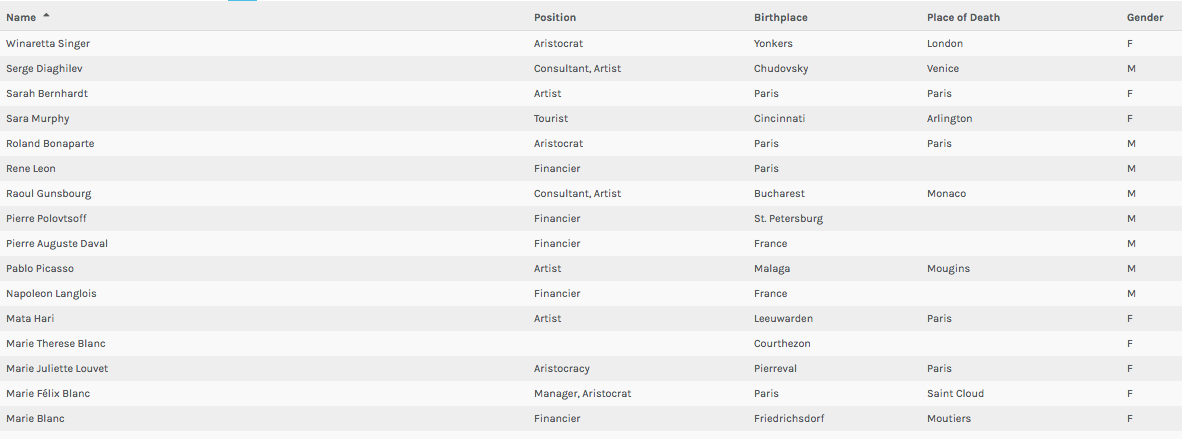
After selecting rows and columns, you can minimize the settings, review your data, sort by your row. The Facet, Timeline, and Timespan filters will dynamically filter this data, and within the settings you can download the data table you’ve created.