Add Map Custom Filters
In addition to loading datasets, it’s possible to add a map custom filters while visualizing data. For instance, circling cities (or historic city locations), or outlining historic political boundaries.
In the “Map” visualization, add a “New layer”, and then go to the “Shapes” tab. Here you can drag & drop or copy & paste a geoJSONfile.
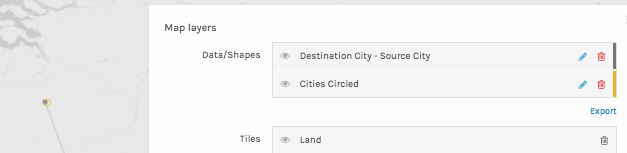
Note that you can update the color assigned these layers (just like with data layers). Also note that by default the most recently loaded layer will be “on top” of the map visualization. For example if your custom layer circles important cities and your data set visualizes routes between these cities, scaled based on the number of travelers, you may want to first load the data set, then load the custom filter.